Industrial Properties: Data Valuation Tips
Valuing industrial properties requires precise methods to avoid costly errors. Unlike residential real estate, these properties depend on functional features like ceiling height, loading docks, and power supply. Here's how to ensure accurate valuations:
- Focus on Net Operating Income (NOI): Use stabilized NOI to avoid inflated values and compare against reliable data sources like CoStar or CBRE.
- Benchmark Cap Rates Locally: National averages aren’t enough. Use regional data to refine cap rates based on property type and market conditions.
- Choose Quality Comparables: Select recent, similar properties and adjust for factors like size, location, and condition.
- Monitor Occupancy and Tenant Quality: High occupancy rates and credit-rated tenants improve valuation stability.
- Account for Market Trends: Analyze local vacancy rates, construction pipelines, and economic indicators to assess risks and potential growth.
- Inspect Property Condition: Use tools like drones and cross-reference maintenance records to uncover hidden costs.
- Apply the Cost Approach for Specialized Assets: For unique properties, calculate land value, replacement costs, and depreciation accurately.
Combining these strategies ensures precise valuations, especially in dynamic markets like Oklahoma City, where vacancy rates and speculative construction can heavily influence property values.
How Are Commercial Properties Valued?
1. Use Net Operating Income (NOI) Analytics
Net Operating Income (NOI) is a cornerstone metric for evaluating industrial properties. It’s calculated by subtracting operating expenses - like taxes, insurance, utilities, management fees, and routine maintenance - from the property's effective gross income. What makes NOI especially valuable is its focus on the property itself, excluding factors like mortgage payments, depreciation, and income taxes. This approach provides a clearer picture of the property's performance, free from the influence of financing decisions.
"NOI is like the pulse of your investment. It's the revenue generated from a property minus operating expenses. When you're looking at an industrial property, the higher the NOI, the healthier the investment." - Ben Fraser, Aspen Funds
NOI serves as the foundation for the Income Capitalization Approach, a widely-used method for valuing income-generating real estate. In this approach, property value is determined by dividing NOI by the cap rate (Property Value = NOI ÷ Cap Rate). For instance, at a 5% cap rate, an increase of $10,000 in NOI can boost a property’s value by $200,000.
In Oklahoma’s industrial sector, NOI tends to be more stable than in office or retail markets. This stability stems from industrial tenants - such as manufacturers or distribution centers - who often sign longer leases due to the high costs of relocating. This results in more consistent cash flow.
One common mistake in property valuation is relying on unstabilized NOI figures. These might include one-time gains like lease termination fees, temporary tax breaks, or lease-up concessions, which can artificially inflate income and lead to overvaluation. Instead, focus on stabilized NOI, which reflects the property's true, ongoing income potential. To ensure accuracy, compare your income and expense estimates against institutional data sources like CoStar or CBRE Econometrics, and benchmark them against similar industrial properties in your specific Oklahoma submarket.
2. Benchmark Cap Rates Using Regional Data
A cap rate represents the annual return on a property, calculated by dividing the Net Operating Income (NOI) by the property’s value. To ensure accurate valuations, cap rates need to be based on up-to-date, local data. Relying only on national averages without considering regional specifics can lead to misjudgments in pricing. To refine your valuations, it’s essential to analyze both national and regional cap rate trends, tailoring them to reflect local market dynamics.
As of Q4 2025, the national industrial cap rate stood at 6.2%, a notable decrease from 7.60% in Q3 2024. This shift points to a market that has stabilized following the post-pandemic adjustments. In Oklahoma, however, the picture requires a deeper dive. Local market conditions often play a significant role in determining where a property fits within a given cap rate range.
"The delivery of large projects and several significant move-outs have driven vacancy rates to decade-high levels at the beginning of the year." - Price Edwards and Company
Here’s a breakdown of cap rate ranges for various industrial property types as of Q1 2026. These figures serve as a baseline but should be adjusted based on the specific conditions of your property:
| Industrial Segment | Cap Rate Range (Q1 2026) |
|---|---|
| Institutional-Grade Logistics | 5.2% – 5.8% |
| Modern Cross-Dock (200k–500k SF) | 5.5% – 6.2% |
| Secondary/Non-Prime Industrial | 6.0% – 7.0% |
| Cold Storage/Specialized | 5.3% – 6.3% |
Source:
When applying these benchmarks, consider property-specific factors. For instance, a building leased to a credit-rated tenant on a long-term agreement will typically justify a lower cap rate compared to a vacant or multi-tenant property. In Oklahoma, Price Edwards and Company provides reliable transaction data that can help fine-tune these adjustments. Additionally, consulting with a local broker is a smart move. They can verify cap rates from comparable sales and account for factors like unique financing terms or sale-leaseback agreements, which might skew the apparent value.
"Cap rates are just one unit of comparison used for evaluating commercial real estate; both macroeconomic and property specific characteristics should be considered when determining an appropriate cap rate for any specific property." - J.P. Morgan Blog
3. Use Comparable Sales Data the Right Way
Alongside NOI analysis and cap rate benchmarking, the Sales Comparison Approach (SCA) provides a straightforward way to estimate market value - if you have reliable data. The formula is simple: SPC ± Adj = V (the sale price of a comparable property, adjusted for differences, equals your estimated value). But here’s the catch: the process hinges on the quality of the comparable properties you use.
In Oklahoma, Price Edwards & Company stands out as a trusted source for industrial transaction data, covering both the Oklahoma City and Tulsa markets. What makes them unique is their hands-on approach - they reach out directly to property owners to collect building-specific details, rather than relying solely on public records.
"We are the only source that provides and publishes specific data on each building in the market [Oklahoma City]." - Price Edwards and Company
This level of detail ensures better selection and adjustment of comparable properties.
When using comparables, focus on data from the past 3–6 months, especially in a fluctuating market. For example, the price per square foot dropped by 4.6% in Q1 2025, and public sales data often lags by about six months. Using outdated data can lead to inaccurate valuations.
Filtering comparables is just as important as finding them. Stick to properties that match these criteria:
- Size: Within 25% of your property’s square footage.
- Building Class: A, B, or C - don’t mix classes.
- Submarket: Stay within the same area or industrial corridor. Even a few miles can significantly impact factors like vacancy rates and rents.
- Purpose: Ensure the properties have the same function. For instance, a distribution center and a manufacturing plant may look similar on paper but serve entirely different purposes.
Once you’ve identified suitable comparables, adjust them using these standard factors:
| Adjustment Factor | When to Adjust | Typical Range |
|---|---|---|
| Location | If the property is in a different submarket or has varying visibility | 5% – 15% |
| Condition | For differences in age, renovations, or deferred maintenance | 3% – 10% |
| Size | To account for variations in square footage | 2% – 8% |
| Occupancy | For significant differences in vacancy rates | 5% – 20% |
| Amenities | Differences in parking, HVAC systems, or loading docks | 3% – 7% |
Source:
Whenever possible, choose comparables that need the fewest adjustments. While three comparables are the minimum for credible analysis, using five or six will give you a tighter, more reliable value range. Also, take a closer look at why a property sold - distressed sales or portfolio deals often don’t reflect actual market conditions and can distort your estimates.
4. Track Occupancy Rates and Tenant Quality Metrics
Tracking occupancy rates and evaluating tenant quality are key steps in refining your property's valuation. Occupancy rates, in particular, are a direct indicator of an industrial property's financial health. Ben Fraser of Aspen Funds puts it simply:
"A lower vacancy rate means more tenants filling your space and more dollars in your pocket."
Even small changes in vacancy rates can lead to significant valuation swings, especially in highly competitive submarkets. For example, as of Q1 2026, prime last-mile industrial properties typically maintain occupancy rates between 93% and 97%, while secondary assets tend to fall between 85% and 90%. Local market dynamics - such as demand and supply trends - play a big role in determining these figures. Understanding where your property fits within these ranges is an essential step for accurate valuation. Just like NOI analysis and cap rate comparisons, occupancy trends provide real-time data that is critical for informed decision-making.
Tenant credit quality is another crucial factor to consider. High-credit tenants not only lower risks but also support higher property valuations. For instance, a building that’s 95% leased to a single investment-grade logistics company is vastly different from one occupied by several smaller, local distributors, even if both properties have similar rent levels and square footage. Properties with specialized features, like custom racking or heavy power, can make relocation expensive for tenants, leading to longer lease terms and more predictable income streams. However, if a high-credit tenant vacates a single-tenant specialized property, you may face extended downtime - potentially exceeding a year - before securing a new tenant.
If you’re managing or evaluating industrial properties in Oklahoma, the following table highlights reliable sources for tracking these metrics:
| Data Source | Best For | Geographic Focus |
|---|---|---|
| Price Edwards & Co. | Building-specific occupancy and local reports | Oklahoma City & Tulsa |
| CompStak | Lease comps, tenant lists, and submarket trends | Oklahoma and National |
| Trepp | CMBS loan performance and delinquency tracking | National/MSA Deep Dives |
| Public Records (County Assessor) | Tax assessments and ownership history | County-level (OK) |
These resources can help you verify and adjust tenant-related income projections. Since different providers use varying methodologies, it’s wise to cross-reference data from multiple sources. For additional support with tenant mix strategies and long-term asset performance in Oklahoma, Trio CRE offers data-driven asset management services tailored to industrial properties.
5. Factor In Market Trends and Economic Indicators
When assessing industrial property valuations, it's critical to account for the broader economic landscape. These macroeconomic factors directly influence both current property values and future potential. Oklahoma City’s recent market activity provides a clear example of how these dynamics play out.
As mentioned earlier, the local market has seen a spike in speculative construction, which has driven up vacancy rates. This surge, primarily occurring between 2022 and 2024, outpaced actual tenant demand. Ignoring this context when valuing an industrial asset in Oklahoma City could lead to overestimating income potential and underestimating the risks tied to leasing.
A thorough analysis of the construction pipeline is essential for accurate valuations. Differentiating between speculative projects and build-to-suit developments helps clarify near-term rent growth potential. Speculative projects typically increase vacancy pressures, while build-to-suit developments do not. Pay special attention to the percentage of pre-leased space in the pipeline - this single metric can reveal a lot about the market's ability to support rent growth in the near future. Beyond local trends, broader economic indicators also play a crucial role in shaping market expectations for industrial properties.
| Indicator | Why It Matters | Where to Find It |
|---|---|---|
| Net absorption vs. new deliveries | Indicates whether demand is keeping up with supply | Price Edwards & Co., CoStar |
| Industry-specific employment growth | Highlights the strength of the labor market for logistics and manufacturing tenants | Bureau of Labor Statistics (BLS) |
| E-commerce spending trends | Drives demand for last-mile and distribution facilities | U.S. Census Bureau (Monthly Retail Trade) |
| Gross Metropolitan Product (GMP) | Tracks Oklahoma City’s economic output relative to national GDP | Bureau of Economic Analysis (BEA) |
On a national level, shifts like the move from "just-in-time" to "just-in-case" inventory strategies and the re-shoring of manufacturing operations are fueling demand for industrial space. While these trends provide a level of support, they don’t entirely offset local challenges. As James Freeman, Managing Director at Bridge Investment Group, explains:
"For the industrial segment, that revolves around understanding local dynamics in terms of the drivers and constraints around each submarket, but also understanding what the overall global supply chain looks like."
6. Assess Property Condition Using Data-Based Methods
So far, we've covered income metrics and market trends, but there's another key piece of the puzzle: the property's condition. This factor often gets less attention, even though it plays a massive role in determining a property's true value. While market data shows how a property stacks up against others, the condition of the building itself tells you what you're really working with. This is especially crucial in Oklahoma, where high vacancy rates make it essential to distinguish well-maintained properties from those with significant deferred maintenance.
Skipping proper due diligence can be a costly mistake - 60% of failed commercial real estate investments stem from inadequate assessments. Even small oversights can lead to expensive errors. For industrial properties, key condition metrics include things like clear ceiling height, floor load capacity, the number and setup of loading docks, power supply capabilities, the age of HVAC and mechanical systems, and any environmental compliance issues (such as findings from a Phase I Environmental Site Assessment).
Thanks to advancements in technology, drones equipped with thermographic cameras are now being used to inspect roofs, building exteriors, and electrical systems more safely and efficiently. As Mark Morgan from VERTEX explains:
"Technological advancements in unmanned aerial vehicles (drones) and thermographic cameras in recent years have created better options for assessors to gather data and evidence for their reporting." - Mark Morgan, VERTEX
Another important step is cross-referencing seller-provided data with T12 statements and utility bills. This can help uncover hidden maintenance issues. The Try Cactus Team highlights the risks of overlooking these details:
"A building with a 25-year-old roof and original mechanical systems might show strong NOI today while quietly requiring $400,000 in capital investment within 24 months." - Try Cactus Team
In Oklahoma, property taxes often reset based on the purchase price, which can lead to higher expenses and a compressed NOI after closing. To prepare for these costs, a good rule of thumb is to set aside 2–4% of the building's replacement cost annually for capital expenditure reserves. This is especially important for older industrial properties with aging roofs or mechanical systems.
7. Apply the Cost Approach for Specialized Industrial Assets
When dealing with unique industrial properties, the cost approach can be a game-changer, especially when income and market data fall short. For facilities with specialized features like heavy-duty crane systems, clean rooms, chemical ventilation, or cold storage units, finding enough comparable sales is often impossible. In these situations, the formula to remember is: Land Value + Replacement Cost of Improvements − Depreciation = Property Value.
The replacement cost calculates what it would take to construct a similar facility with modern materials and methods, offering equivalent utility. On the other hand, the reproduction cost involves replicating the original structure exactly. For most industrial assets in Oklahoma, the replacement cost is the more practical and relevant choice. Given the unique nature of many specialized properties in Oklahoma's industrial market, where local sales data can be unreliable, this approach focuses on the property's physical features to establish value. It also sets a foundation for a precise analysis of depreciation.
Depreciation is a critical factor in this method. Physical depreciation should be assessed using maintenance records and photos rather than relying on generic age tables. Another key consideration is functional obsolescence, which can significantly affect older industrial properties. As TaxFightBack explains:
"Functional obsolescence is your most powerful argument for older industrial properties."
For example, features like ceiling heights below 20 feet, column spacing under 50 feet, or electrical service below 800 amps can reduce a property's modern utility, which should be reflected in its valuation.
Additionally, economic obsolescence - external factors that impact value - must be documented. Rising vacancy rates or infrastructure limitations, such as roads that can't handle heavy loads, can weigh heavily on value. Use vacancy surveys and rent trend data to illustrate these pressures. For properties near Oklahoma City (OKC) or Tulsa transport hubs, it's important to verify land value using industrial-zoned comparables rather than relying on generic land sales.
This detailed, data-driven approach ensures that valuations for specialized industrial assets are accurate and fair.
Comparison Table
Traditional vs. Data-Driven Industrial Property Valuation Methods
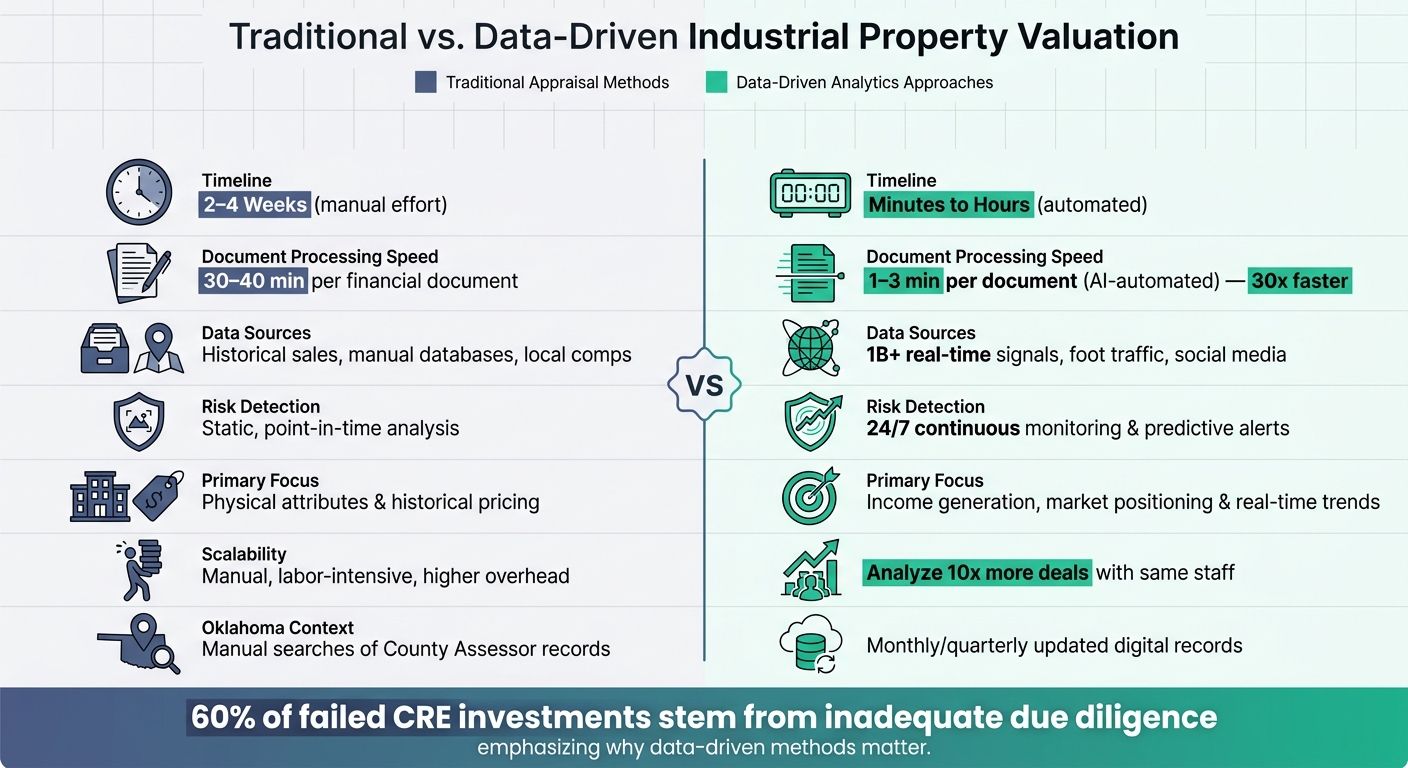
The difference between traditional appraisal methods and data-driven approaches isn't just about technology - it’s about speed, precision, and staying ahead in a competitive market. As Smart Capital Center explains:
"Traditional evaluation methods no longer work when you compete with firms that analyze deals in minutes, not days."
In Oklahoma's industrial real estate market, speed is a game-changer. Traditional appraisals usually take 2 to 4 weeks of manual effort, while data-driven platforms can complete the same analysis in minutes to hours - making document processing up to 30 times faster.
Here’s a side-by-side look at how these approaches stack up:
| Feature | Traditional Appraisal Methods | Data-Driven Analytics Approaches |
|---|---|---|
| Timeline | 2–4 weeks | Minutes to hours |
| Data Sources | Historical sales, manual databases, local comps | 1B+ real-time signals, foot traffic, social media |
| Document Processing | 30–40 minutes per financial document | 1–3 minutes per document (AI-automated) |
| Risk Detection | Static, point-in-time analysis | 24/7 continuous monitoring and predictive alerts |
| Primary Focus | Physical attributes and historical pricing | Income generation, market positioning, and real-time trends |
| Scalability | Manual labor-intensive; higher overhead | Analyze 10x more deals with the same staff |
| Oklahoma Context | Manual searches of County Assessor records | Monthly/quarterly updated digital records |
This table makes it clear: data-driven tools bring measurable advantages, especially for fast-paced evaluations. Considering that 60% of failed commercial real estate investments stem from inadequate due diligence, these tools not only save time but also minimize errors and flag risks before they escalate.
For industrial assets in Oklahoma, local expertise combined with analytics is key. Firms like Trio CRE merge deep knowledge of the Oklahoma market with data-powered strategies, helping investors achieve more accurate and defensible valuations for their properties.
Conclusion
Valuing industrial properties demands a blend of data-driven strategies. From analyzing NOI and cap rates to monitoring occupancy trends and applying the cost approach, using multiple methods ensures a more precise valuation. Incorporating tenant quality metrics and market indicators further strengthens the accuracy of appraisals, even as market conditions shift.
As A-Credited Realty Advisors aptly states:
"High-quality industrial real estate appraisals expertly synthesize massive amounts of data from multiple rigorous methodologies to skillfully create an indisputably accurate final property valuation."
Oklahoma's industrial market presents unique challenges. Vacancy rates have reached their highest levels in a decade as of early 2024, and year-over-year rent growth has stalled due to heightened construction activity. Relying on just one valuation method can leave critical gaps. Instead, combining the cost approach, income capitalization, and sales comparison methods provides a more comprehensive and defensible analysis. This integrated approach helps maintain reliable valuations, even in volatile markets.
Here’s a striking example: a $10,000 change in NOI at a 5% cap rate can shift a property’s value by $200,000. This underscores the importance of scrutinizing not just the numbers but the assumptions behind them.
For industrial property owners navigating Oklahoma's market, Trio CRE offers localized expertise. Their services turn raw data into actionable strategies, covering everything from investment sales to asset management, with tailored insights for key markets like Oklahoma City and Tulsa.
FAQs
How do I calculate stabilized NOI for an industrial building?
To figure out stabilized NOI (Net Operating Income), you need to calculate the property's yearly income after accounting for operating expenses, based on typical, long-term occupancy levels. Here's how:
Start with the gross operating income. This includes potential rent minus any vacancy or credit losses, plus any additional income from things like parking fees or laundry facilities. From this amount, subtract the operating expenses - things like property taxes, insurance, utilities, and maintenance costs.
It's important to note what NOT to include: mortgage interest, depreciation, and income taxes. These are excluded from the calculation.
Stabilized NOI represents the property's consistent income under normal conditions, making it a dependable metric for property valuation and investment decisions.
How do I pick the right cap rate for Oklahoma City or Tulsa?
To determine the appropriate cap rate for industrial properties in Oklahoma City or Tulsa, start by examining local market trends and industry benchmarks. Look into recent sales or lease agreements of comparable properties to gauge how similar assets are being valued by investors. These "market comparables" provide a practical snapshot of current expectations.
Additionally, dive into capitalization rate studies or other industry-specific reports. These resources can help confirm that your selected cap rate matches the property’s income potential and aligns with the latest market conditions.
What’s the fastest way to verify comps, occupancy, and tenant quality?
The fastest way to check comps, occupancy rates, and tenant quality is by using data analytics tools and reviewing market comparables. Examining recent sales or lease data for similar properties can reveal insights into fair market values and tenant demographics. Today’s advanced valuation tools make this process even smoother by analyzing market trends and providing instant, actionable data - helping you make quicker, well-informed decisions.